Image Details
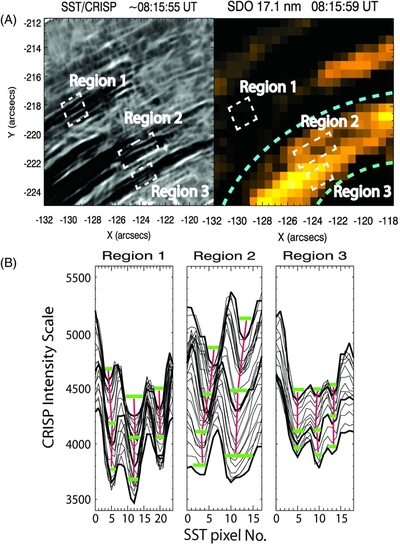
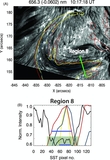
Caption: Figure 5.
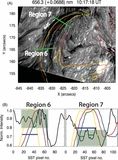
Fine-scale, multi-stranded and multi-thermal substructures are detected within the coronal loop-top and are presented here for the blue dashed box region of Figure 3. The Hα line position of +0.1032 nm image (grayscale), is shown in panel (A), together with the near-simultaneous and co-spatial AIA 17.1 nm image. Regions 1–3 in panel (A) are selected for investigation of the Hα intensity profile as data cross-cuts along the loop-top system, which are represented in panel (B). As with Figure 4, parallel strands are identified using green lines separated by pink lines marking strand channels. Regions 2 and 3 are particularly highly structured in the Hα line profiles.
Other Images in This Article
Copyright and Terms & Conditions
© 2014. The American Astronomical Society. All rights reserved.