Image Details
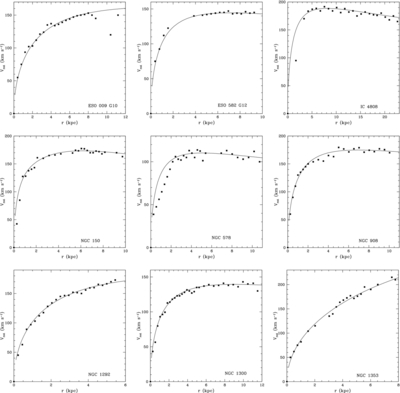
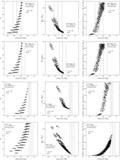
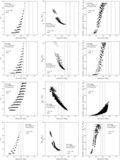
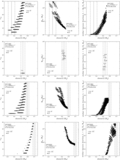
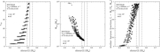
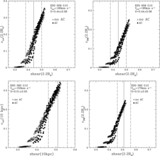
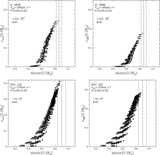
Caption: Figure 5.
Observed rotation curves with the overlaid model rotation curves for 13 galaxies. The errors on the data points are typically <10% (Persic & Salucci 1995). The solid lines represent the rotation curve that best matches the observed shear at 2.2Rd.
Other Images in This Article
Show More
Copyright and Terms & Conditions
© 2014. The American Astronomical Society. All rights reserved.
Copyright ©
2025 Astronomy Image Explorer. All Rights Reserved.