Image Details
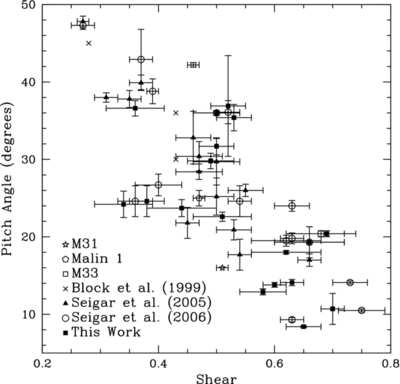
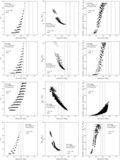
Caption: Figure 1.
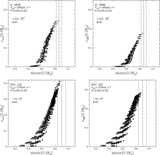
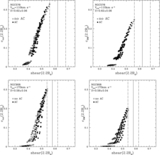
Spiral arm pitch angle vs. rotation curve shear rate, showing a correlation. The filled triangles represent galaxies with data measured by Seigar et al. (2005), the open circles are galaxies from Seigar et al. (2006), the crosses are galaxies from Block et al. (1999), the open square represents data for M33 (Seigar 2011), the open pentagon represents data for Malin 1 (Seigar 2008), the star represents data for M31 (Seigar et al. 2008a), and the filled squares represent the data from the present sample.
Other Images in This Article
Show More
Copyright and Terms & Conditions
© 2014. The American Astronomical Society. All rights reserved.
Copyright ©
2025 Astronomy Image Explorer. All Rights Reserved.