Image Details
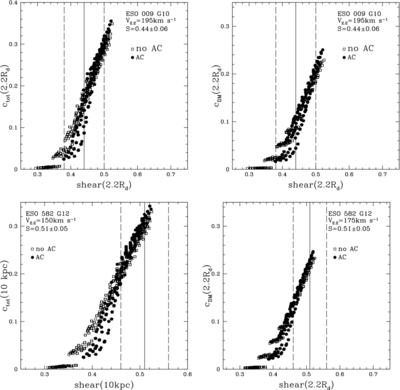
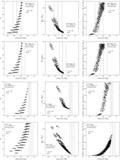
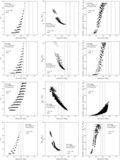
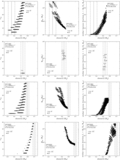
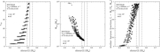
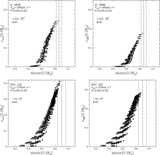
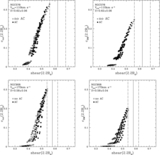
Caption: Figure 4.
Model results for 13 galaxies. Left: central mass concentration (mass fraction within 2.2Rd) vs. shear; right: dark matter concentration (dark matter mass fraction within 2.2Rd) vs. shear. The open squares represent the model without adiabatic contraction of the stellar halo and filled circles represent the model with adiabatic contraction. The vertical lines present the measured shear (solid line) with the 1σ error added and subtracted (dashed lines).
Other Images in This Article
Show More
Copyright and Terms & Conditions
© 2014. The American Astronomical Society. All rights reserved.
Copyright ©
2025 Astronomy Image Explorer. All Rights Reserved.