Image Details
Caption: Figure 6.
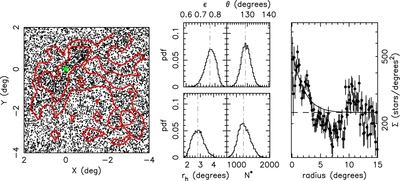
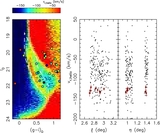
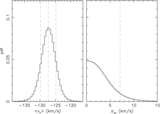
Structure of the overdensity in the PAndAS MW stream. The left-most panel displays the spatial distribution of all stars in the CMD selection box 3 of Figure 1 at the location of the overdensity. The red contours are isodensity contours of 250 and 345 stars per square degree, built from a smoothed density map. While the overdensity is obvious, its shape is irregular. The green star indicates its centroid, as derived from the determination of its structural parameters. The middle set of four panels displays the marginalized probability distribution functions (pdfs) of four parameters of the structural model: the ellipticity, ![]() , defined as 1 − b/a with a and b as the major and minor axis scale lengths, respectively; the position angle, θ, defined from north to east; the half-light radius of the exponential profile, rh; and the number of overdense stars within the CMD selection box, N*. In all four panels, the gray dot-dashed line represents the favored model, i.e., the mode of the marginalized pdfs. The right-most panel presents the profile of the data, binned following the favored model parameters, with the favored exponential profile with a flat background (thin black line). The background alone is represented by the dashed line. The fit is obviously not a good one as it cannot capture the varying structure of the field. However, it reasonably reproduces the central overdensity, albeit with too shallow a profile.
, defined as 1 − b/a with a and b as the major and minor axis scale lengths, respectively; the position angle, θ, defined from north to east; the half-light radius of the exponential profile, rh; and the number of overdense stars within the CMD selection box, N*. In all four panels, the gray dot-dashed line represents the favored model, i.e., the mode of the marginalized pdfs. The right-most panel presents the profile of the data, binned following the favored model parameters, with the favored exponential profile with a flat background (thin black line). The background alone is represented by the dashed line. The fit is obviously not a good one as it cannot capture the varying structure of the field. However, it reasonably reproduces the central overdensity, albeit with too shallow a profile.
Other Images in This Article


Copyright and Terms & Conditions
© 2014. The American Astronomical Society. All rights reserved.