Image Details
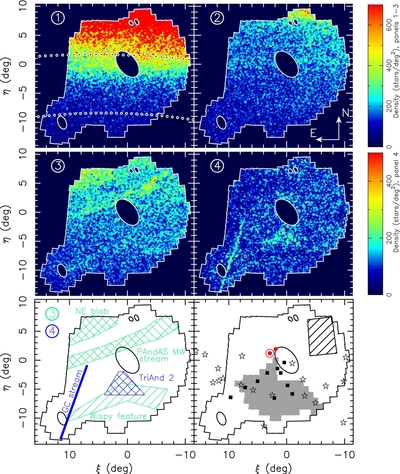
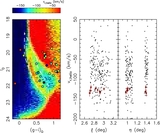
Caption: Figure 2.
Top two rows of panels: smoothed density maps of stars from the four selection boxes highlighted in the right panel of Figure 1. Stars are binned with pixels of 2![]() 5 × 2
5 × 2![]() 5 and smoothed with a Gaussian kernel of dispersion 5′. North is to the top and east to the left, while the color codes the stellar density as indicated in the color scales next to the panels. The white polygon delimits the footprint of the PAndAS survey and the ellipses represent the four regions around M31, M33, NGC 147, and NGC 185 that are masked out to avoid contamination. In the top-left panel, the dotted, curved lines are lines of constant Galactic latitude at b = −20° (top) and b = −30° (bottom). The panels correspond to heliocentric distances of about 7, 11, 17, and 27 kpc from top-left to bottom-right. Bottom-left panel: sketch of the stellar structures visible in panels 3 (green) and 4 (blue) and mentioned in the text. Bottom-right panel: coverage of previous surveys used to discover or study the stellar halo in the direction of M31. The black squares correspond to the fields of Majewski et al. (2004) while the gray polygon represents the footprint of the CFHT data that was studied by Martin et al. (2007b). The hollow stars show the location of the radial-velocity-selected TriAnd giant stars from Rocha-Pinto et al. (2004). The region we use in Section 4.3 to determine the structure of a potential progenitor to the PAndAS MW stream corresponds to the hashed polygon. The red, circled dot highlights the DEIMOS field in which we find a velocity signal likely stemming from the PAndAS MW stream (see Section 4.4) and the red dot corresponds to the location of the And IX dwarf galaxy for which the radial velocities of Tollerud et al. (2012) show a similar contamination.
5 and smoothed with a Gaussian kernel of dispersion 5′. North is to the top and east to the left, while the color codes the stellar density as indicated in the color scales next to the panels. The white polygon delimits the footprint of the PAndAS survey and the ellipses represent the four regions around M31, M33, NGC 147, and NGC 185 that are masked out to avoid contamination. In the top-left panel, the dotted, curved lines are lines of constant Galactic latitude at b = −20° (top) and b = −30° (bottom). The panels correspond to heliocentric distances of about 7, 11, 17, and 27 kpc from top-left to bottom-right. Bottom-left panel: sketch of the stellar structures visible in panels 3 (green) and 4 (blue) and mentioned in the text. Bottom-right panel: coverage of previous surveys used to discover or study the stellar halo in the direction of M31. The black squares correspond to the fields of Majewski et al. (2004) while the gray polygon represents the footprint of the CFHT data that was studied by Martin et al. (2007b). The hollow stars show the location of the radial-velocity-selected TriAnd giant stars from Rocha-Pinto et al. (2004). The region we use in Section 4.3 to determine the structure of a potential progenitor to the PAndAS MW stream corresponds to the hashed polygon. The red, circled dot highlights the DEIMOS field in which we find a velocity signal likely stemming from the PAndAS MW stream (see Section 4.4) and the red dot corresponds to the location of the And IX dwarf galaxy for which the radial velocities of Tollerud et al. (2012) show a similar contamination.
Other Images in This Article


Copyright and Terms & Conditions
© 2014. The American Astronomical Society. All rights reserved.