Image Details
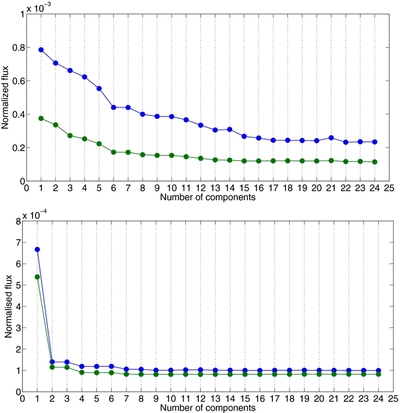
Caption: Figure 18.
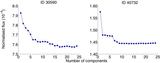
Top: ObsID 30590; blue, mean quadratic deviations between the transit signals estimated through method 2, with the n most important components, and the one estimated through method 1, using the 5 × 5 array; green, the same, considering the binned signals. Bottom: the same for ObsID 40732.
Other Images in This Article


Show More
Copyright and Terms & Conditions
© 2014. The American Astronomical Society. All rights reserved.
Copyright ©
2025 Astronomy Image Explorer. All Rights Reserved.