Image Details
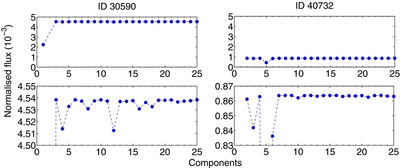
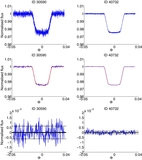
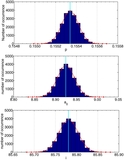
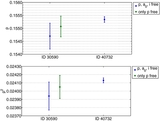
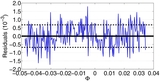
Caption: Figure 2.
Top: standard deviations of the residuals of the single-component fits, normalized to out-of-transit level; 5 × 5 array. Bottom: the same, zooming on the topmost part of the curve.
Other Images in This Article


Show More
Copyright and Terms & Conditions
© 2014. The American Astronomical Society. All rights reserved.
Copyright ©
2025 Astronomy Image Explorer. All Rights Reserved.