Image Details
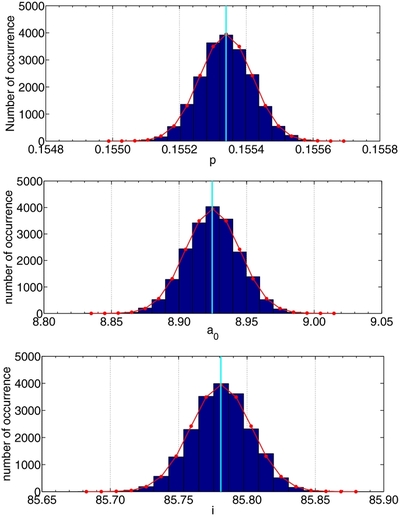
Caption: Figure 7.
From top to bottom, histograms of the sampled chains for parameters p, a 0, and i, respectively, relative to the time series estimated from the 5 × 5 array, considering all the independent components, without including the ICA error (ObsID 40732). The overplotted red curves show Gaussian distributions with the sampled means and variances. The light blue vertical lines indicate the starting values, determined through the Nelder–Mead optimization (see Sections 2.3 and 2.4).
Other Images in This Article


Show More
Copyright and Terms & Conditions
© 2014. The American Astronomical Society. All rights reserved.
Copyright ©
2025 Astronomy Image Explorer. All Rights Reserved.