Image Details

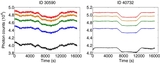
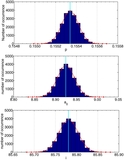
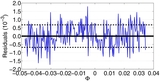
Caption: Figure 6.
Top panel: transit time series extracted using the 5 × 5 array, considering all the independent components (see Section 2.3). Middle panel: (blue) the same series, binned by nine points, (red) relative best model fit. Bottom panel: residuals between the extracted time series and the model. Dashed black lines indicate the standard deviations of the residuals.
Other Images in This Article


Show More
Copyright and Terms & Conditions
© 2014. The American Astronomical Society. All rights reserved.
Copyright ©
2025 Astronomy Image Explorer. All Rights Reserved.