Image Details
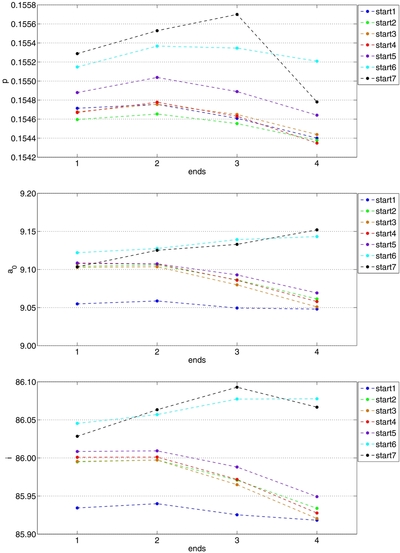
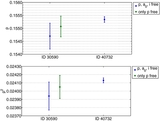
Caption: Figure 15.
From top to bottom: best values of the parameters p, a 0, and i, respectively, for the transit signals obtained through method 2, from different sub-data sets. They are extracted using the 5 × 5 array, by removing all the independent components from the integral light curve. The curves were binned by nine points before performing the fits. Different colors are used depending on the starts, indexed from earlier to later with increasing integers: blue, start 1; green, start 2; ecru, start 3; red, start 4; purple, start 5; cyan, start 6; black, start 7. Index from 1 to 4 on the horizontal axis indicate different ends, from later to earlier (ObsID 30590).
Other Images in This Article


Show More
Copyright and Terms & Conditions
© 2014. The American Astronomical Society. All rights reserved.