Image Details
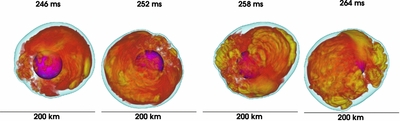
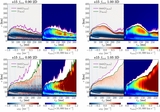
Caption: Figure 7.
Entropy volume renderings for s15 f heat1.00 3D at late times showing the development of the SASI. Four different postbounce times are shown, spaced 6 ms apart, from left to right. The shock itself is visible as the pale blue surfaces, as in Figure 2, and constant-density contours with a value of 10 12 g cm −3 (magenta) mark the edge of the PNS. At this stage the shock shows clear spiral motion, as indicated by the spherical harmonic components shown in Figure 6.
Other Images in This Article
Show More
Copyright and Terms & Conditions
© 2014. The American Astronomical Society. All rights reserved.
Copyright ©
2025 Astronomy Image Explorer. All Rights Reserved.