Image Details
Caption: Figure 1.
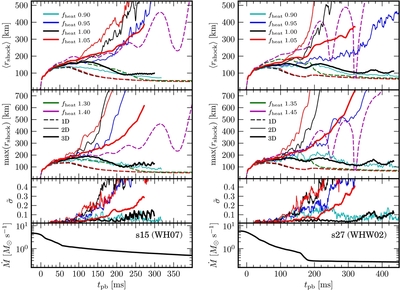
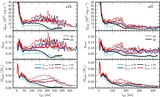
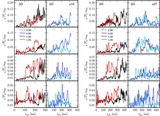
Shock diagnostics for s15 (left) and s27 (right). The top panels display the average shock radii for simulations in 1D, 2D,
and 3D for various heat factors,
f
heat. The second panels display the maximum shock radii for the same. The third panels show the standard deviation of the shock
radius, weighted by the average shock radius,
 . The bottom panels show the mass accretion rates for each progenitor, evaluated at a fixed radius of 500 km. Explosion occurs
for all 2D simulations with
f
heat ⩾ 0.95, while in 3D a heat factor of 1.05 is required to achieve explosion in both s15 and s27. Much higher heat factors
are required for explosion in 1D, as shown, and s27 requires a slightly higher critical heat factor (1.45) than s15 (1.40).
The shock structure in 2D is universally more asymmetric, as evidenced by
. The bottom panels show the mass accretion rates for each progenitor, evaluated at a fixed radius of 500 km. Explosion occurs
for all 2D simulations with
f
heat ⩾ 0.95, while in 3D a heat factor of 1.05 is required to achieve explosion in both s15 and s27. Much higher heat factors
are required for explosion in 1D, as shown, and s27 requires a slightly higher critical heat factor (1.45) than s15 (1.40).
The shock structure in 2D is universally more asymmetric, as evidenced by
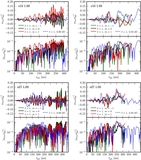
 . For 3D, the normalized standard deviations of the shock remain relatively small until either an explosion sets in or the
SASI develops at late times. The periodic oscillations that typify the SASI are evident in the 3D failed explosions, particularly
so in s15. The relatively higher frequency and amplitude of the SASI oscillations in s15 are due to the greater mass accretion
rate at late times as compared with s27 (see Foglizzo et al. 2007).
. For 3D, the normalized standard deviations of the shock remain relatively small until either an explosion sets in or the
SASI develops at late times. The periodic oscillations that typify the SASI are evident in the 3D failed explosions, particularly
so in s15. The relatively higher frequency and amplitude of the SASI oscillations in s15 are due to the greater mass accretion
rate at late times as compared with s27 (see Foglizzo et al. 2007).
Other Images in This Article
Show More
Copyright and Terms & Conditions
© 2014. The American Astronomical Society. All rights reserved.