Image Details
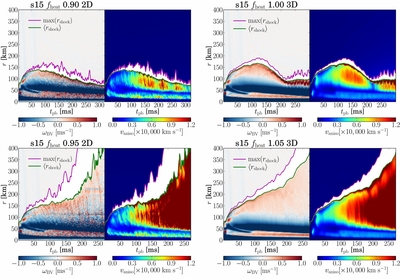
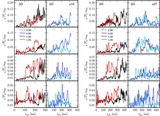
Caption: Figure 10.
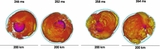
Pseudo-color plots of the spherically averaged Brunt–Väisälä frequencies, ω BV (left half of each panel), and spherically averaged anisotropic velocities, v aniso (right half of each panel), as functions of time for s15 in both 2D and 3D. The top two panels display the critical non-exploding models, s15 f heat0.90 2D and s15 f heat1.00 3D, and the bottom panels show the critical exploding models, s15 f heat 0.95 2D and s15 f heat 1.05 3D. Overplotted are the average (green lines) and maximum (magenta lines) shock radii. In between the maximum and average shock radii, we zero out both ω BV and v aniso since their calculation is unreliable in this region.
Other Images in This Article
Show More
Copyright and Terms & Conditions
© 2014. The American Astronomical Society. All rights reserved.