Image Details
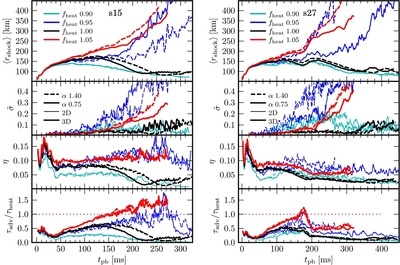
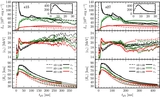
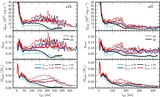
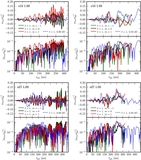
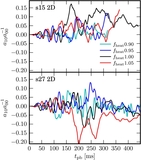
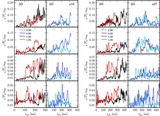
Caption: Figure 16.
Various global metrics for 2D and 3D simulations at different resolutions for s15 (left) and s27 (right). The top panels are the average shock radius, the second panels are the normalized standard deviation of the shock radius, the third panels are the net heating efficiency, and the bottom panels are the ratio of advection to heating timescales. Shown only are the critical exploding and non-exploding cases. There is very little significant difference in the global metrics between the 3D simulations at different resolutions. The differences are larger for 2D, although as shown in Table 1, these differences are reduced for larger f heat.
Other Images in This Article
Show More
Copyright and Terms & Conditions
© 2014. The American Astronomical Society. All rights reserved.