Image Details
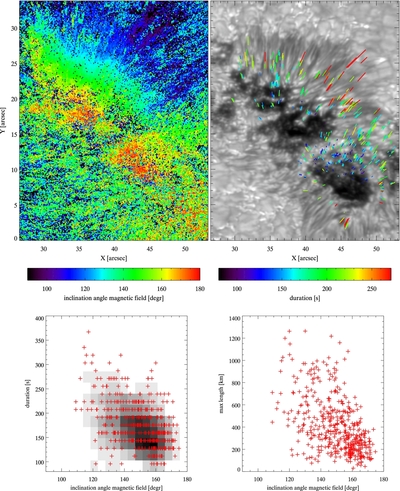
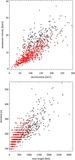
Caption: Figure 8.
Relation between magnetic field inclination and dynamic fibril duration and length. The top left panel shows a map of the magnetic field inclination from LTE inversion of the Ca ii 8542 Stokes data. 180° is a vertical, negative polarity field; 90° is a horizontal field. The top right panel shows a continuum Ca ii 8542 image with the paths of the top of 460 dynamic fibrils drawn. The color of the paths indicates the duration of the dynamic fibril. The bottom left panel shows a scatter plot of the duration of the dynamic fibrils vs. the inclination angle of the magnetic field at the lowest point of the path of the top of the dynamic fibril (red crosses). The inclination angle is the average value of a 3 × 3 pixel area. In the background, a smoothed density image of the same data points is shown with an inverted color table. The bottom right panel shows a scatter plot of the maximum length of the path of the top of the dynamic fibrils vs. the magnetic field inclination.
Other Images in This Article
Copyright and Terms & Conditions
© 2013. The American Astronomical Society. All rights reserved.