Image Details
Caption: Figure 2.
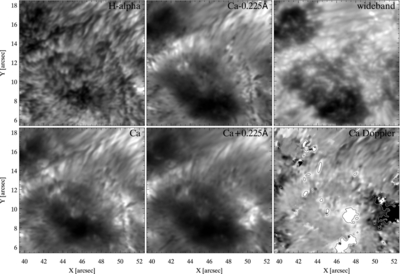
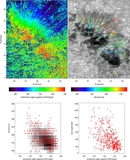
Zoom-in on part of the sunspot (region marked with a square in Figure 1). Upper left: Hα line center. Lower left: map of Ca ii 8542 line minimum intensity. Upper middle: Ca ii 8542 blue wing at −0.225 Å. Lower middle: Ca ii 8542 red wing at +0.225 Å. Upper right: photosphere in Hα wideband. Lower right: map of Ca ii 8542 Doppler shift, scaled between ±5 km s −1; the gray contours mark regions where the parabolic fit did not yield a reasonable Doppler measurement.
(An animation of this figure is available in the online journal.)
Other Images in This Article
Copyright and Terms & Conditions
© 2013. The American Astronomical Society. All rights reserved.
Copyright ©
2025 Astronomy Image Explorer. All Rights Reserved.