Image Details
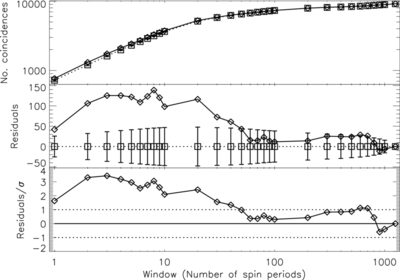
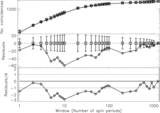
Caption: Figure 4.
Top: comparison of the number of PATTERN ⩽12 X-ray photons from PSR J1819−1458 within the 0.5–2.6 keV energy range of the PN and MOS cameras that are coincident with a radio pulse within a given search window. X-ray photons coincident with the radio pulses are represented by diamonds and a solid line while the results of our simulation are represented by the squares (mean coincident photons of the simulations), vertical bars (standard deviation of coincident photons of the simulations), and the dotted line. Middle: the difference in the number of coincident photons for each window size in the data and the mean of the simulations. Bottom: as the middle plot, normalized by the standard deviation of the simulations. Here the horizontal dotted line indicates one standard deviation of the simulated random sets.
Other Images in This Article
Copyright and Terms & Conditions
© 2013. The American Astronomical Society. All rights reserved.