Image Details
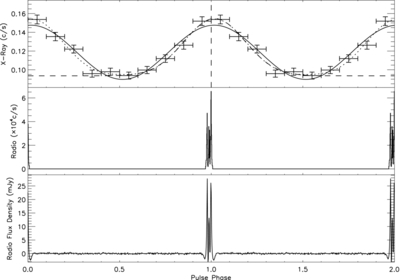
Caption: Figure 1.
X-ray and radio profiles of PSR J1819−1458 folded using the radio ephemeris. Top: the background-corrected X-ray profile consists
of 10 phase bins over one rotational period, which consists of
XMM-Newton PN and MOS detected photons within the 0.5 keV <
E < 2.6 keV energy range within the GTIs and PATTERN ⩽12, summing up to ~17 hr of observation time. The horizontal and vertical
bars indicate the size of the phase bins and the
 errors. The solid, dotted, and dashed lines indicate the single sinusoid, two sinusoid, and Gaussian fits to the profile
(fit over the 0.5–1.5 phase range), respectively. Note that the dotted and dashed lines overlap considerably. The vertical
dashed line indicates the peak of the radio pulse profile (phase = 1.0). Middle: radio pulse count histogram created by using
the radio ephemeris to assign a phase to each barycentered pulse detected by the 7.7 hr observation of the GBT at an observing
frequency of 2 GHz, and then binning all the radio pulse arrival times into a 2048 bin histogram. Bottom: radio flux density
profile formed from pulses detected using the 7.7 hr observation of the GBT at an observing frequency of 2 GHz. Flux densities
were calculated by normalizing the scale of each detected pulse's off-pulse noise to the radiometer noise, then averaging
all the pulses together. The dips preceding and following the pulse are due to digitization of the signal (e.g., Jenet & Anderson
1998). The profile is shown twice in all plots for clarity.
errors. The solid, dotted, and dashed lines indicate the single sinusoid, two sinusoid, and Gaussian fits to the profile
(fit over the 0.5–1.5 phase range), respectively. Note that the dotted and dashed lines overlap considerably. The vertical
dashed line indicates the peak of the radio pulse profile (phase = 1.0). Middle: radio pulse count histogram created by using
the radio ephemeris to assign a phase to each barycentered pulse detected by the 7.7 hr observation of the GBT at an observing
frequency of 2 GHz, and then binning all the radio pulse arrival times into a 2048 bin histogram. Bottom: radio flux density
profile formed from pulses detected using the 7.7 hr observation of the GBT at an observing frequency of 2 GHz. Flux densities
were calculated by normalizing the scale of each detected pulse's off-pulse noise to the radiometer noise, then averaging
all the pulses together. The dips preceding and following the pulse are due to digitization of the signal (e.g., Jenet & Anderson
1998). The profile is shown twice in all plots for clarity.
Other Images in This Article
Copyright and Terms & Conditions
© 2013. The American Astronomical Society. All rights reserved.