Image Details
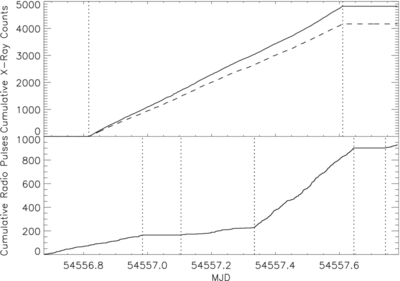
Caption: Figure 3.
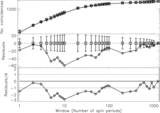
Top: cumulative count of X-ray photon detections from PSR J1819−1458. The solid line represents all X-ray photons while the dashed only includes the photons with energies within the range 0.5–2.6 keV. Dashed vertical lines designate the beginning and end of the GTIs. In both cases, we only include photons from the source region described in Section 2.1. Bottom: cumulative radio pulses detected by the following radio telescopes over time—Parkes, Effelsberg, GBT, and then Parkes again. Dashed vertical lines indicate the beginnings and endings of the radio telescopes' observing time. Different radio observing frequencies and sensitivities bring about the different slopes of the cumulative radio pulse distribution. The two flat regions of the distribution are attributed to the times when the pulsar was not observed.
Other Images in This Article
Copyright and Terms & Conditions
© 2013. The American Astronomical Society. All rights reserved.