Image Details
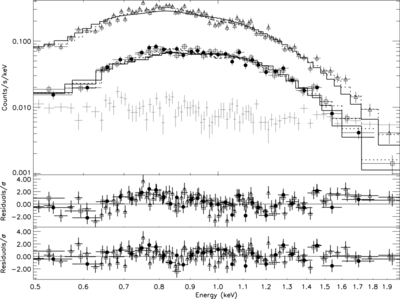
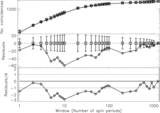
Caption: Figure 2.
X-ray spectrum of PSR J1819−1458 using photons with energies in the 0.5–2.0 keV range and PATTERN ⩽4 from both our observation and McLaughlin et al. (2007). Data have been rebinned for plotting purposes by a factor of two from 157, 63, and 66 bins to 78, 30, and 33 bins for PN, MOS1, and MOS2, respectively. Top: the dark crosshairs indicate the PN (triangles), MOS1 (filled circles), and MOS2 (squares) source spectra, respectively. The light crosshairs represent the PN background spectrum. The solid lines indicate the simplest model fit, a blackbody with interstellar absorption, an underabundance of oxygen, and solar abundances from Lodders (2003) for elements other than hydrogen and oxygen ( vphabs*bbody); while the dotted lines indicate one of the best model fits ( vphabs*gabs*gabs*bbody), which also includes two Gaussian absorption lines around 1.0 and 1.3 keV. Middle: normalized PN (triangles), MOS1 (filled circles), and MOS2 (squares) residuals for the vphabs*bbody model. Bottom: normalized PN (triangles), MOS1 (filled circles), and MOS2 (squares) residuals for the vphabs*gabs*gabs*bbody model.
Other Images in This Article
Copyright and Terms & Conditions
© 2013. The American Astronomical Society. All rights reserved.