

Image Details
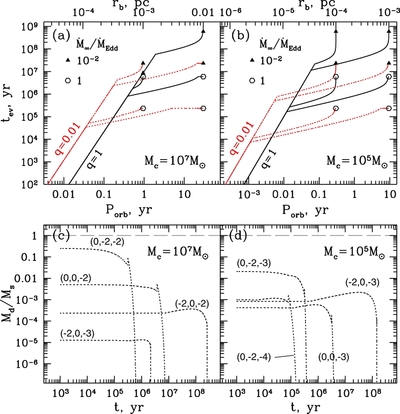
Caption: Figure 7.
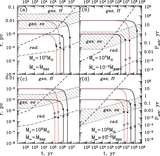
(a) and (b) Evolution timescale
t
ev = |
dln
r
b
/
dt|
−1 of SMBH binaries as a function of orbital period
P
orb or semi-major axis
r
b
(upper axis; use to read off the initial semi-major axis
r
b
(0)). Starting points for each evolutionary track are marked by either triangles (for
 ) or hexagons (for
 ). Solid (black) and dotted (red) curves are used for the
q = 1 and
q = 10
−2 binary tracks, respectively. Straight portions of these tracks at low
P
orb correspond to the epoch when the orbital evolution of the binary is dominated by GW emission. Note that prior to these epochs,
tracks starting at different
r
b
(0) do not overlap, illustrating the hysteresis of the binary evolution caused by the non-local nature of the self-consistent
disk–binary coupling. (c and d) Ratio of the local disk mass
M
d
to the secondary mass
M
s
for a sub-sample of evolutionary tracks displayed in Figure
6, showing that
M
d
/
M
s
). Solid (black) and dotted (red) curves are used for the
q = 1 and
q = 10
−2 binary tracks, respectively. Straight portions of these tracks at low
P
orb correspond to the epoch when the orbital evolution of the binary is dominated by GW emission. Note that prior to these epochs,
tracks starting at different
r
b
(0) do not overlap, illustrating the hysteresis of the binary evolution caused by the non-local nature of the self-consistent
disk–binary coupling. (c and d) Ratio of the local disk mass
M
d
to the secondary mass
M
s
for a sub-sample of evolutionary tracks displayed in Figure
6, showing that
M
d
/
M
s
 1 in our calculations. Different tracks are labeled as
 . See the text for details.
Other Images in This Article
Copyright and Terms & Conditions
© 2013. The American Astronomical Society. All rights reserved.

