

Image Details
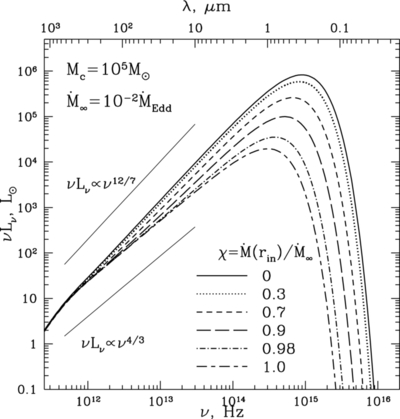
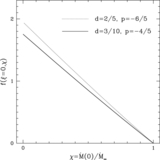
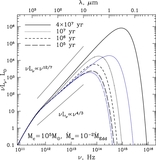
Caption: Figure 10.
Dependence of the disk spectrum on the fraction of mass inflow
 that penetrates across the orbit of the secondary and leaves the circumbinary disk. Different curves correspond to different
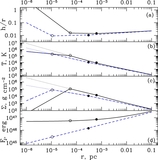
χ as labeled on the panel. Calculations were done for the situations depicted by the solid curves in Figure
9, i.e., after 4 × 10
7 yr of evolution of the disk+binary system shown there.
that penetrates across the orbit of the secondary and leaves the circumbinary disk. Different curves correspond to different
χ as labeled on the panel. Calculations were done for the situations depicted by the solid curves in Figure
9, i.e., after 4 × 10
7 yr of evolution of the disk+binary system shown there.
Other Images in This Article
Copyright and Terms & Conditions
© 2013. The American Astronomical Society. All rights reserved.

Copyright ©
2026 Astronomy Image Explorer. All Rights Reserved.
