

Image Details
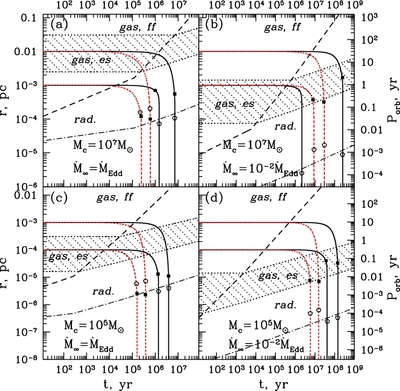
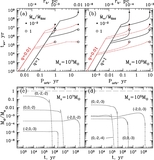
Caption: Figure 6.
Evolutionary tracks of SMBH binaries for different values of
M
c
= 10
7, 10
5
M
☉ and
 , 10
−2, labeled on the panels. Tracks for
q = 1 (solid black) and 10
−2 (dotted red) are shown and in each panel we consider two starting values of the binary semi-major axis
r
b
(0). The layout of these plots and meaning of different curves and labels are the same as in Figure
5. In particular, the dashed and dot-dashed curves show the runs of
r
infl (Equation (60)) and
r
Edd (Equation (72)), respectively, and the black square dots mark the transition to the GW-dominated orbital decay. The open
pentagons mark the possible onset of gas overflow; see Section 6.2.7. See the text for a detailed description of the evolution.
, 10
−2, labeled on the panels. Tracks for
q = 1 (solid black) and 10
−2 (dotted red) are shown and in each panel we consider two starting values of the binary semi-major axis
r
b
(0). The layout of these plots and meaning of different curves and labels are the same as in Figure
5. In particular, the dashed and dot-dashed curves show the runs of
r
infl (Equation (60)) and
r
Edd (Equation (72)), respectively, and the black square dots mark the transition to the GW-dominated orbital decay. The open
pentagons mark the possible onset of gas overflow; see Section 6.2.7. See the text for a detailed description of the evolution.
Other Images in This Article
Copyright and Terms & Conditions
© 2013. The American Astronomical Society. All rights reserved.

