Image Details
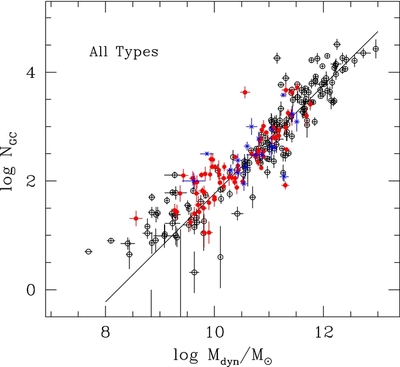
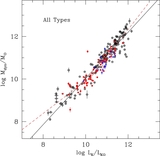
Caption: Figure 9.
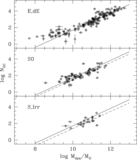
Correlation of GC population size
N
GC vs. the dynamical mass
 . E galaxies are plotted as open circles, S0s as solid red circles, and spirals as blue crosses. The
N-values for the S0 and spiral types have been normalized to the E-galaxy level as described in the text. The solid diagonal
line shows the best-fit solution for all galaxies with
M
dyn > 10
10
M
☉.
. E galaxies are plotted as open circles, S0s as solid red circles, and spirals as blue crosses. The
N-values for the S0 and spiral types have been normalized to the E-galaxy level as described in the text. The solid diagonal
line shows the best-fit solution for all galaxies with
M
dyn > 10
10
M
☉.
Other Images in This Article
Show More
Copyright and Terms & Conditions
© 2013. The American Astronomical Society. All rights reserved.
Copyright ©
2026 Astronomy Image Explorer. All Rights Reserved.