Image Details
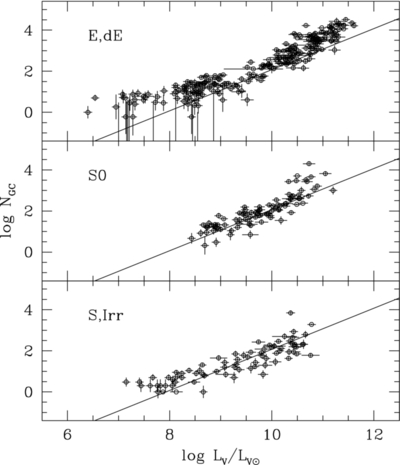
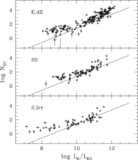
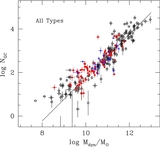
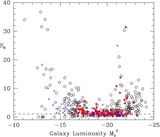
Caption: Figure 5.
Top panel: total number of globular clusters N GC plotted vs. the visual luminosity of the host galaxy, for elliptical galaxies. Middle panel: the same plot for S0 galaxies. Bottom panel: the same plot for spiral and irregular galaxies. In all three panels, the sloped line denotes a specific frequency S N ≡ 1.
Other Images in This Article
Show More
Copyright and Terms & Conditions
© 2013. The American Astronomical Society. All rights reserved.
Copyright ©
2026 Astronomy Image Explorer. All Rights Reserved.