Image Details
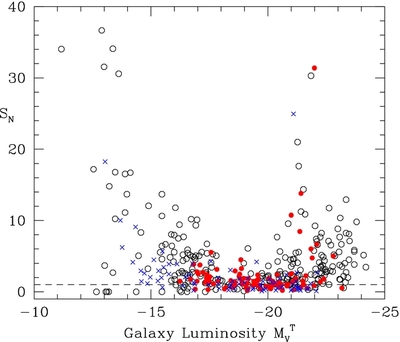
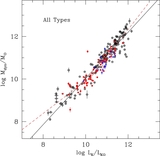
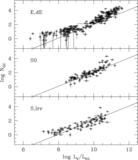
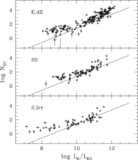
Caption: Figure 10.
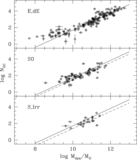
Specific frequency
S
N
vs. the absolute visual magnitude
 of the host galaxy. E and dE galaxies are plotted as open circles, S0 systems as solid red circles, and spirals or irregulars
as blue crosses. The horizontal line at bottom shows
S
N
= 1.
of the host galaxy. E and dE galaxies are plotted as open circles, S0 systems as solid red circles, and spirals or irregulars
as blue crosses. The horizontal line at bottom shows
S
N
= 1.
Other Images in This Article
Show More
Copyright and Terms & Conditions
© 2013. The American Astronomical Society. All rights reserved.
Copyright ©
2026 Astronomy Image Explorer. All Rights Reserved.