Image Details
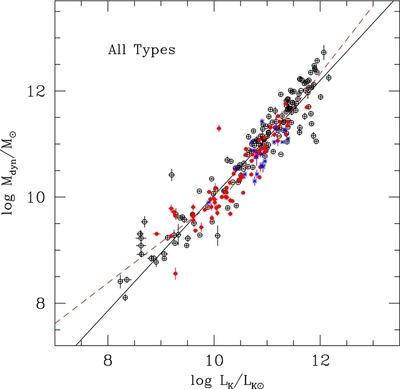
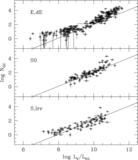
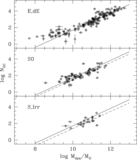
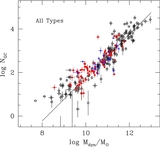
Caption: Figure 4.
M dyn plotted vs. total K-band luminosity L K for the galaxies in the GCS catalog. The E/dE systems are plotted as open circles, S0 as red filled symbols, and S/Irr systems as blue crosses. The solid diagonal line shows the best-fit linear solution to the entire sample, as described in the text, whereas the dashed line shows the two-part solution over the bright and faint ranges as in Table 2.
Other Images in This Article
Show More
Copyright and Terms & Conditions
© 2013. The American Astronomical Society. All rights reserved.
Copyright ©
2026 Astronomy Image Explorer. All Rights Reserved.