Image Details
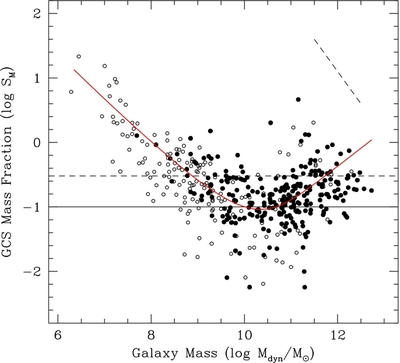
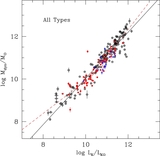
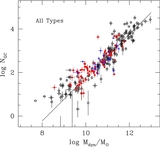
Caption: Figure 14.
Specific mass S M = 100( M GCS/ M dyn) vs. host galaxy mass. Solid dots are dynamical masses M dyn calculated from ( R e , σ e ), while open circles are masses estimated from L V and Equation (3), for galaxies without measurements of R e and σ e . The solid diagonal line at upper right shows the effect of changing M dyn by 1.0 dex (an increase in M dyn yields a proportionate decrease in S M ~ M GCS/ M dyn). The horizontal line at S M = 0.1 is the approximate average level reached for the intermediate-luminosity galaxies where star formation is maximally efficient. Eighty percent of all galaxies fall below the dashed horizontal line at S M = 0.3 (see text). The superimposed curve is the interpolation model fit discussed in Section 4.2.
Other Images in This Article
Show More
Copyright and Terms & Conditions
© 2013. The American Astronomical Society. All rights reserved.