Image Details
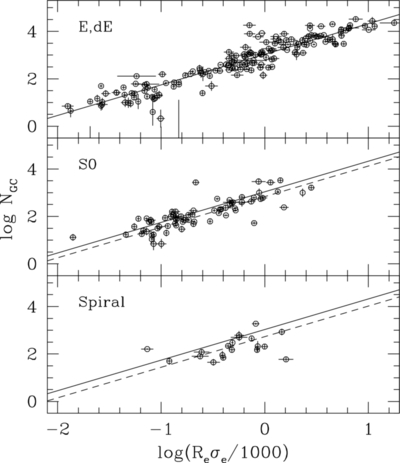
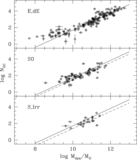
Caption: Figure 12.
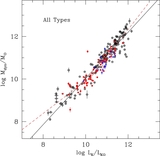
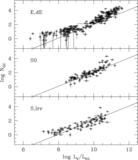
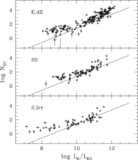
GC population size N GC vs. ( R e σ e ) as defined in the text. The data are shown separately for ellipticals, S0s, and spirals as in previous figures. In each panel the solid diagonal line shows the best-fit solution for the E galaxies, but now including both dwarfs and giants. In the second panel, the dashed line shows the E-galaxy line shifted downward by 0.2 dex, while in the lower panel the dashed line shows the E-galaxy solution shifted down by 0.3 dex.
Other Images in This Article
Show More
Copyright and Terms & Conditions
© 2013. The American Astronomical Society. All rights reserved.
Copyright ©
2026 Astronomy Image Explorer. All Rights Reserved.