Image Details
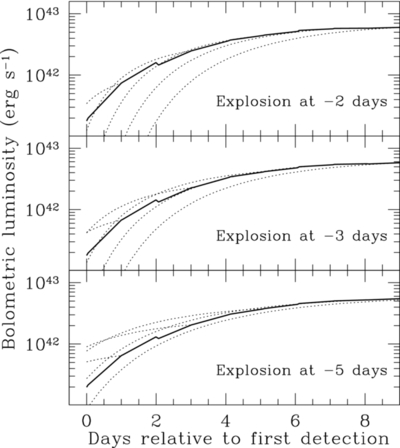
Caption: Figure 4.
Bolometric luminosity of PTF 10vgv (thick, solid curves). From the top panel to the bottom panel, we consider explosion times of two, three, and five days before the first detection. In all cases, we fix E = 10 51 erg and M = 2 M ☉. For each light curve, at various times we consider what the diffusive tail coming from that depth would look like at earlier times (dotted lines) using Equation (10). From this comparison, we conclude that if the SN occurred recently (top panel), then only the earliest heating may be explained by a diffusive tail and the majority of the rising light curve directly probes the 56Ni distribution. On the other hand, if the explosion occurred further in the past (the middle and bottom panels), then the majority of the rising light curve can be explained as a diffusive tail due to deep deposits of 56Ni. This example demonstrates the degeneracy between the time of explosion and the depth of 56Ni if only a photometric light curve is available.
Other Images in This Article


Copyright and Terms & Conditions
© 2013. The American Astronomical Society. All rights reserved.