Image Details

Caption: Figure 1.
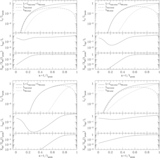
Schematic diagram showing the early light curves for SNe I and how they relate to the photospheric radius and velocity. The top and middle panels demonstrate how the relative positions of the shock-heating light curve (blue curves, discussed in Section 2.2), diffusive tail light curve (purple curves, discussed in Section 2.4), and the 56Ni light curve (red curves, discussed in Section 2.3) can differ depending on the depth of the 56Ni. The total observed light curve is the sum of these three components. Note that these light curves are meant to replicate the shapes when the luminosity is plotted logarithmically and the time is plotted linearly. When the 56Ni is deposited deeply (in the middle panel) and the shock-heating light curve (blue curve) is below the detection limits, there can be a significant dark phase between the time of explosion and the moment of first detection. In the bottom panel, we show how the photospheric radius (orange curve) and velocity (green curve) evolve with time. Depending on the position of the 56Ni light curve, different photospheric radii, velocities, and velocity gradients will be present when the rising light curve is observed. These provide clues about the depth of the 56Ni and the time of explosion, as summarized in the middle panel and discussed in the text.
Other Images in This Article


Copyright and Terms & Conditions
© 2013. The American Astronomical Society. All rights reserved.