Image Details
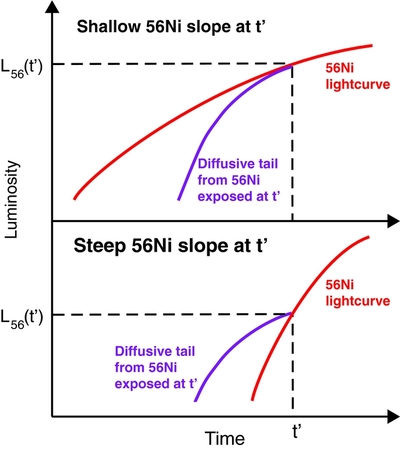
Caption: Figure 2.
Schematic diagram showing how the slope of the 56Ni distribution determines the relative importance of the diffusive tail. In both the top and bottom panels, a luminosity L 56( t′) would be produced at time t′ from the diffusion wave probing the 56Ni distribution. In the top panel, the slope of the 56Ni is shallow, which produces a shallow slope for L 56 (shown by the red curve). If a diffusive tail luminosity is drawn back from this point (shown by the purple curve), it always falls below the 56Ni light curve. Thus, the diffusive tail from this depth is not important. In the bottom panel, the slope of the 56Ni distribution is steeper. Therefore, the diffusive tail from larger depths overpowers the heating from 56Ni at shallower depths, and the diffusive tail from this depth impacts the light curve.
Other Images in This Article


Copyright and Terms & Conditions
© 2013. The American Astronomical Society. All rights reserved.