Image Details
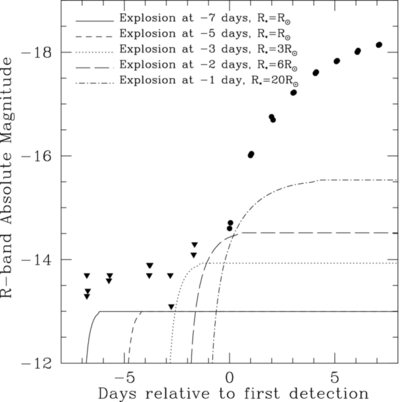
Caption: Figure 3.
Circles and triangles plot the data for PTF 10vgv from Corsi et al. (2012) for the detections and upper limits, respectively. The curves show theoretical calculations of the shock heating light curves using Equations (1) and (2), which are set to plateau at a temperature of ≈0.6 eV, for a range of explosion times and radii as labeled. In all cases, we fix E = 10 51 erg and M = 2 M ☉ for the sake of comparison. The main conclusion is that without direct identification of the time of explosion, the radius upper limit constraint can vary by an order of magnitude or more.
Other Images in This Article


Copyright and Terms & Conditions
© 2013. The American Astronomical Society. All rights reserved.
Copyright ©
2025 Astronomy Image Explorer. All Rights Reserved.