Image Details
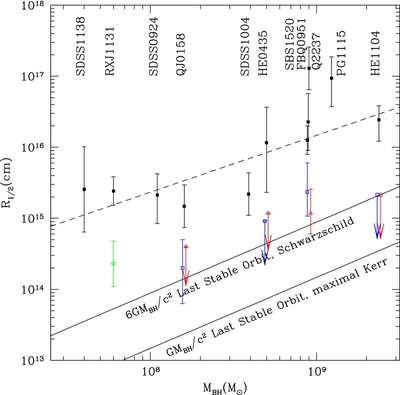
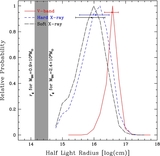
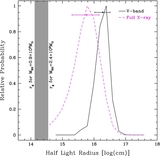
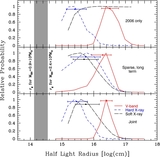
Caption: Figure 8.
Emission region half-light radii as a function of black hole mass M BH based in part on results from Chartas et al. (2009), Dai et al. (2010), Morgan et al. (2010, 2012), Blackburne et al. (2011a), and J. A. Blackburne et al. (2013, in preparation). The filled squares represent optical sizes corrected to a rest wavelength of λ = 2500 Å assuming R λ∝λ 4/3 for comparison. The correction is only significant for RXJ1131. Open triangles and squares are for the hard and soft X-ray sizes, respectively. Small offsets between the soft and hard X-ray data were applied for clarity. The diamonds correspond to full band X-ray size estimates. The upper limits are indicated by arrows. The dashed line corresponds the Morgan et al. (2010) fit to the optical data.
Other Images in This Article
Copyright and Terms & Conditions
© 2013. The American Astronomical Society. All rights reserved.