Image Details
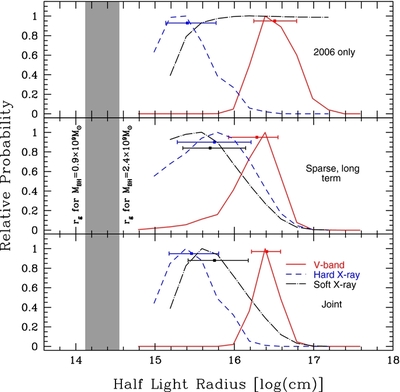
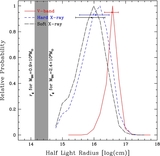
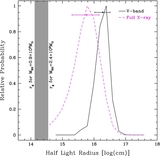
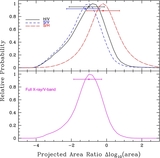
Caption: Figure 7.
Probability distributions of the half-light radii for the V-band (solid), soft X-ray (dash-dotted), and hard X-ray (dashed) emission considering different sections of the X-ray light curves. The top panel shows the results corresponding to the analysis of the 2006 data, the middle panel to the sparse long-term X-ray data, and the bottom panel shows the combined results. As in Figure 4, the gray area corresponds to predicted values of r g .
Other Images in This Article
Copyright and Terms & Conditions
© 2013. The American Astronomical Society. All rights reserved.
Copyright ©
2025 Astronomy Image Explorer. All Rights Reserved.