Image Details
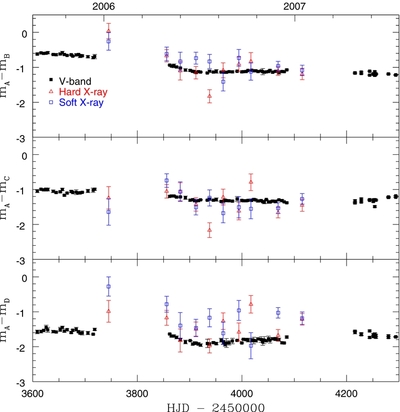
Caption: Figure 3.
Closer view of the Chandra light curves during Cycle 7. The OGLE V-band data overlapping this period of time are also shown for comparison. The filled squares represent the V band, and the open triangles and squares represent the hard and soft X-ray bands, respectively.
Other Images in This Article
Copyright and Terms & Conditions
© 2013. The American Astronomical Society. All rights reserved.
Copyright ©
2025 Astronomy Image Explorer. All Rights Reserved.