Image Details
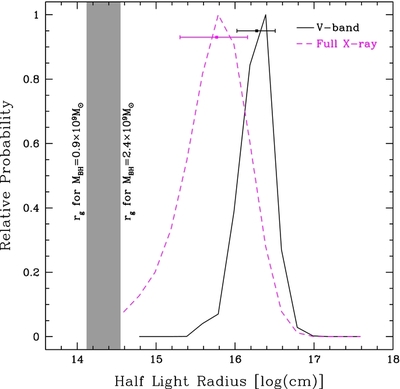
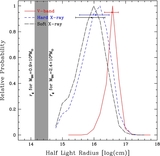
Caption: Figure 5.
Probability distributions for the half-light radii of the V-band (solid) and full X-ray (dashed) emission. The gray area corresponds to predicted values of r g , where the lower and upper limits are for M BH = 0.9 × 10 9 M ☉ (C iv; Morgan et al. 2010) and M BH = 2.4 × 10 9 M ☉ (Hβ; Assef et al. 2011), respectively.
Other Images in This Article
Copyright and Terms & Conditions
© 2013. The American Astronomical Society. All rights reserved.
Copyright ©
2025 Astronomy Image Explorer. All Rights Reserved.