Image Details
Caption: Figure 7.
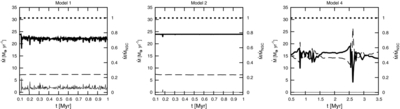
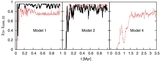
Mass deposition, accumulation, and outflow rates. Left and right axes show scales of absolute and relative quantities, respectively.
Dotted lines represent
 , thick solid lines display
 , dashed lines show
 , and thin solid lines represent
 . The average values are given in Table 2.
Other Images in This Article
Copyright and Terms & Conditions
© 2013. The American Astronomical Society. All rights reserved.
Copyright ©
2025 Astronomy Image Explorer. All Rights Reserved.