Image Details
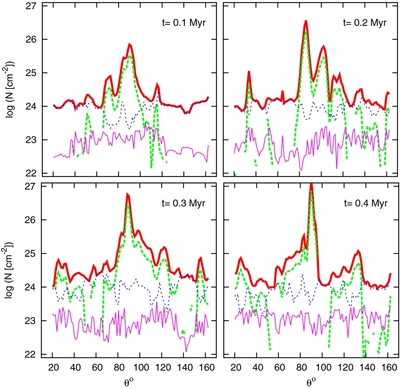
Caption: Figure 4.
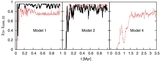
Column densities as seen from the central SMBH for the reference model. The thick solid red line displays the total column density along each line of sight. The thin solid magenta line shows the column density for hot gas, T ⩾3 × 10 5 K. The thin-dotted blue line represents the column density for warm phase, 1500 K < T <3 × 10 5 K. The column densities of cold matter ( T ⩽ 1500 K) are shown by thick-dotted green lines. The cold gas does not cover all the sky.
Other Images in This Article
Copyright and Terms & Conditions
© 2013. The American Astronomical Society. All rights reserved.
Copyright ©
2025 Astronomy Image Explorer. All Rights Reserved.