Image Details
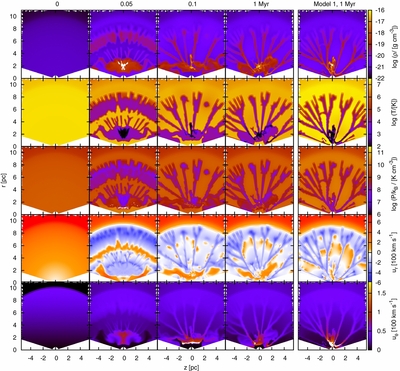
Caption: Figure 2.
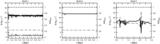
Time sequence of the distribution of the hydrodynamic variables in the reference model. All panels show the z– r plane, with the z-axis running horizontally. Each column displays frames at the time indicated on the top, for each variable indicated at the end of each row. As a comparison, the last column shows the corresponding variables for model 1 at t = 1 Myr.
Other Images in This Article
Copyright and Terms & Conditions
© 2013. The American Astronomical Society. All rights reserved.
Copyright ©
2025 Astronomy Image Explorer. All Rights Reserved.