Image Details
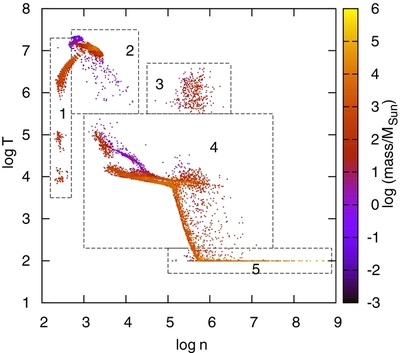
Caption: Figure 3.
Phase diagram for the standard model. Temperature vs. number density at t = 1 Myr. The diagram was gridded into 70 2 cells with the masses of the points depicted in color. We identify five components of the flow: (1) wind, (2) hot thermalized gas, (3) heated gas in the torus, (4) filaments and clumps, and (5) cold dense core of the torus. The gas tends to settle at stable regions in the cooling curve, in particular, at around 10 4 K, however, the squared dependence of the cooling rate on density leads to lower temperatures.
Other Images in This Article
Copyright and Terms & Conditions
© 2013. The American Astronomical Society. All rights reserved.
Copyright ©
2025 Astronomy Image Explorer. All Rights Reserved.