Image Details
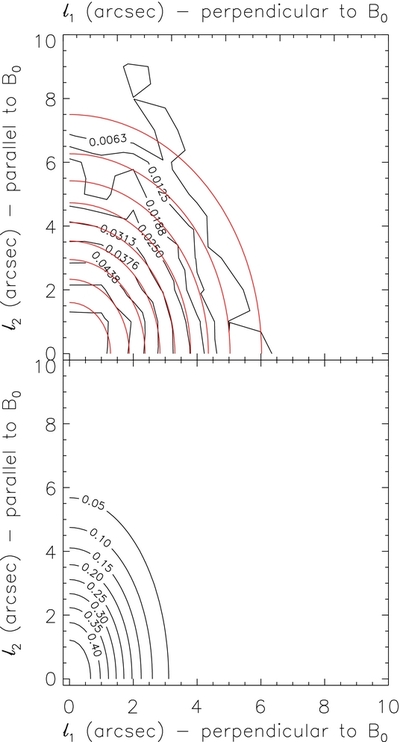
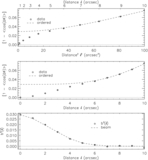
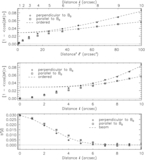
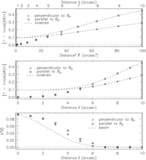
Caption: Figure 13.
Top: contour plot of the two-dimensional turbulence autocorrelation function (black) and a Gaussian fit (red); the fit is
forced to be even in directions parallel and perpendicular to the mean magnetic field. The contours are drawn at 10%–90% (10%
increments) of the peak
b
2(0) = 0.063. Bottom: the intrinsic turbulence autocorrelation function, where we set
W = 0, α = π/2, and
N = 1 in Equations (19) and (21), while using the values for δ
|| and δ
⊥ obtained with the Gaussian fit (red) in the plot on the top graph (see Table 3). The contours are drawn at 10%–90% (10% increments)
of the peak
 .
.
Other Images in This Article
Show More
Copyright and Terms & Conditions
© 2013. The American Astronomical Society. All rights reserved.