Image Details
Caption: Figure 1.
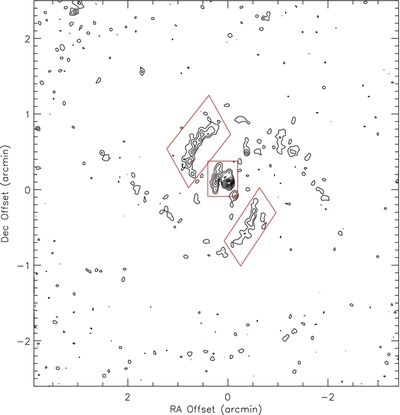
Polarized flux at λ6.2 cm for M51. There are three regions that can be independently used (or combined) for a dispersion analysis:
the spiral arms in the northeast and southwest, and the center of the galaxy. These regions are contained within the corresponding
three red parallelograms in the figure. The map is centered at
 , decl. (J2000) = 47°11′43
![]() 5, and the contours are drawn at 20%–80% (10% increments) of the peak polarized flux density (173 μJy beam
−1).
5, and the contours are drawn at 20%–80% (10% increments) of the peak polarized flux density (173 μJy beam
−1).
Other Images in This Article
Show More
Copyright and Terms & Conditions
© 2013. The American Astronomical Society. All rights reserved.
Copyright ©
2025 Astronomy Image Explorer. All Rights Reserved.