Image Details
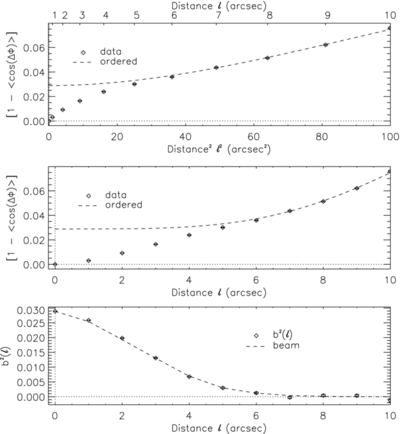
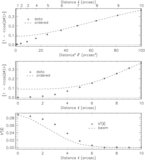
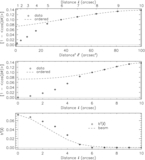
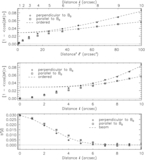
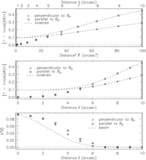
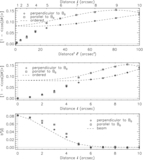
Caption: Figure 4.
Isotropic dispersion function for the northeast spiral arm as a function of ℓ 2 (top) and ℓ (middle). The broken curve ("ordered") is the least-squares fit for the sum of the turbulent-to-total magnetic energy ratio and the ordered component to data contained within 6 ⩽ ℓ ⩽ 10; data are represented with symbols. Bottom: the magnetized turbulence autocorrelation function b 2(ℓ) obtained by subtracting the data from the aforementioned fit of the middle graph. The broken curve shows the radial profile of the "mean autocorrelated synthesized beam."
Other Images in This Article
Show More
Copyright and Terms & Conditions
© 2013. The American Astronomical Society. All rights reserved.
Copyright ©
2025 Astronomy Image Explorer. All Rights Reserved.