Image Details
Caption: Figure 2.
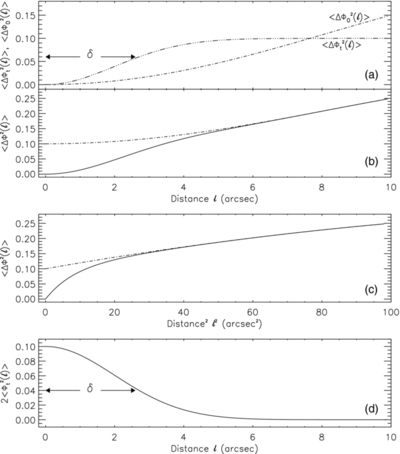
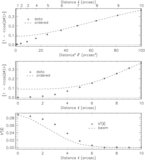
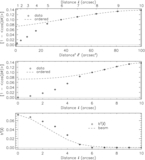
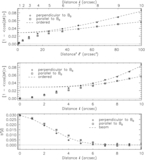
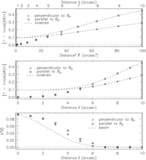
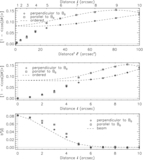
Example of an angular structure function. Panel (a) shows hypothetical turbulent
 (triple-dot-broken curve) and ordered
 (dot-broken curve) contributions to the total angular structure function
![]() ΔΦ
2(ℓ)
ΔΦ
2(ℓ)
![]() plotted in panel (b) (solid curve). Panel (c) presents the same information as panel (b) but displayed as a function of ℓ
2 instead of ℓ. The total angular structure function is subtracted from a Taylor series fit obtained from its values at ℓ ⩾
6'' (dot-broken curve in panels (b) and (c)) to get the turbulent autocorrelation function shown in panel (d). The correlation
length characterizing turbulence is represented by δ.
plotted in panel (b) (solid curve). Panel (c) presents the same information as panel (b) but displayed as a function of ℓ
2 instead of ℓ. The total angular structure function is subtracted from a Taylor series fit obtained from its values at ℓ ⩾
6'' (dot-broken curve in panels (b) and (c)) to get the turbulent autocorrelation function shown in panel (d). The correlation
length characterizing turbulence is represented by δ.
Other Images in This Article
Show More
Copyright and Terms & Conditions
© 2013. The American Astronomical Society. All rights reserved.