Image Details
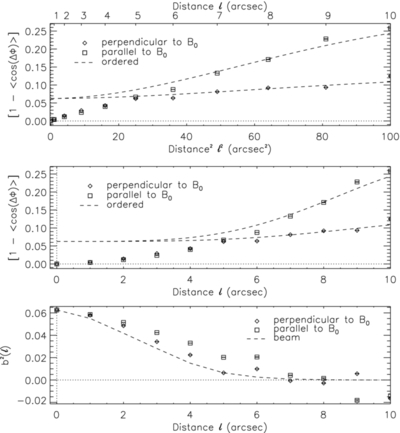
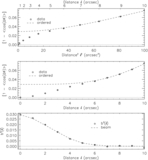
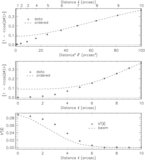
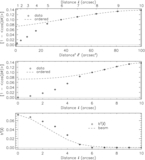
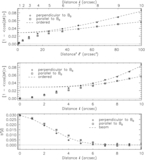
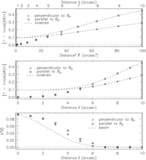
Caption: Figure 12.
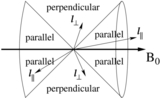
Top and middle: cuts through the two-dimensional dispersion function (symbols) and the ordered fits (broken curves; using values of 7 ⩽ ℓ ⩽ 10) along directions parallel and perpendicular to the mean magnetic field. Bottom: the corresponding profiles for the turbulence autocorrelation function.
Other Images in This Article
Show More
Copyright and Terms & Conditions
© 2013. The American Astronomical Society. All rights reserved.
Copyright ©
2025 Astronomy Image Explorer. All Rights Reserved.