

Image Details
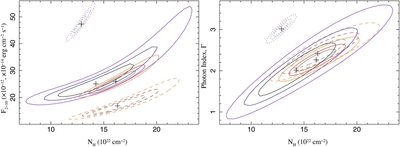
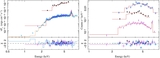
Caption: Figure 5.
Confidence contours for Sgr A* spectral parameters at several epochs: mean unabsorbed 2–10 keV flux vs. X-ray absorbing column, N H, (left) and photon index vs. N H (right). Black/blue/purple lines are for the quiescent (dotted lines) and major flare (solid lines) emission observed by Chandra in ObsID 14392. Brown/red/orange lines are for flare emission observed by XMM-Newton on 2007 April 4 (dashed lines) and on 2002 October 3 (solid lines; Porquet et al. 2003, 2008), re-analyzed with the same spectral model as applied to the Chandra observation. Contours are 68%, 90%, and 99% significance for two interesting parameters. Flare flux is in units of 10 −12 erg cm −2 s −1 and quiescent flux is in units of 10 −14 erg cm −2 s −1.
Other Images in This Article
Copyright and Terms & Conditions
© 2012. The American Astronomical Society. All rights reserved.

