

Image Details
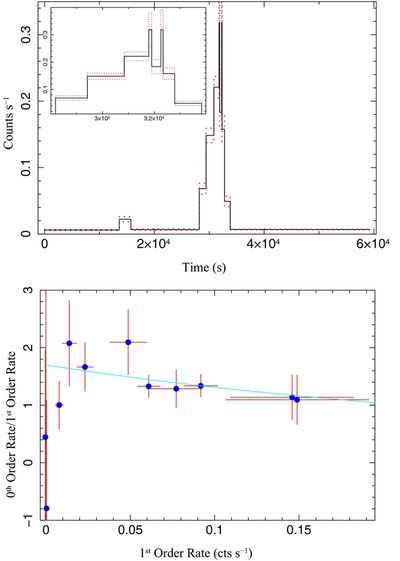
Caption: Figure 2.
Top: for ObsID 14392, the summed zeroth- and first-order count rates (solid line) with 1σ errors (dotted line) during intervals found by the Bayesian Blocks algorithm (using a 98.2% significance level for each change point). The major flare start and stop times are 2012 February 9, 14:25:50 and 15:59:51 UTC. Bottom: for each Bayesian Block, after subtracting the mean quiescent level rate, the ratio of the zeroth-order rate to the summed first-order rates vs. the summed first-order rates. (Error bars are 1σ.) The light blue line is the expected correlation if the intrinsic (i.e., unpiled) zeroth-order rate is 1.7× the first-order rate and the pileup parameter α = 1.
Other Images in This Article
Copyright and Terms & Conditions
© 2012. The American Astronomical Society. All rights reserved.

