

Image Details
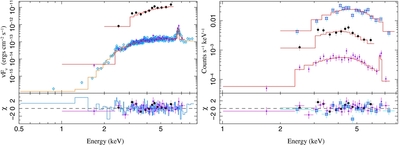
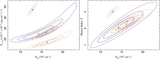
Caption: Figure 4.
Left: summed, flux-corrected spectra for the inner 1
 25 radius surrounding Sgr A*, with the fit presented in Table 1. Spectra represent quiescent emission (ACIS-I, hollow blue
circles; and HETG zeroth order, solid purple squares) and the bright flare mean emission (HETG ± first orders, solid black
circles). Right: the same spectra (absent ACIS-I spectra) shown as detector counts s
−1 keV
−1 and now including zeroth-order spectra for the flare (hollow blue squares).
25 radius surrounding Sgr A*, with the fit presented in Table 1. Spectra represent quiescent emission (ACIS-I, hollow blue
circles; and HETG zeroth order, solid purple squares) and the bright flare mean emission (HETG ± first orders, solid black
circles). Right: the same spectra (absent ACIS-I spectra) shown as detector counts s
−1 keV
−1 and now including zeroth-order spectra for the flare (hollow blue squares).
Other Images in This Article
Copyright and Terms & Conditions
© 2012. The American Astronomical Society. All rights reserved.

Copyright ©
2026 Astronomy Image Explorer. All Rights Reserved.
